
[Unity][教程]Memory Management in Unity
Proper memory management in Unity can be challenging. The goal of this guide is to fit you with the necessary knowledge to profile and optimize memory consumption on any publicly available platform.
1.A guide to optimizing Memory
Proper memory management in Unity can be challenging. You need to consider the nuances of automatic memory management, understand the difference between native and managed memory, and how memory behaves on different platforms. The goal of this guide is to fit you with the necessary knowledge to profile and optimize memory consumption on any publicly available platform.
2.Managed Memory
Understanding the managed heap is essential for memory management in Unity. For more information on profiling managed memory and how to optimize memory, see the understanding managed memory section of the Understanding Optimization in Unity guide.
Assets
Assets cause native memory and managed memory implication during runtime. The Unity runtime doesn’t return managed memory to the operating system for reuse until the user terminates the application. The managed heap grows if it becomes too fragmented and runs out of available memory. Due to this unpredictable behavior, it is critical to know how Assets occupy managed memory:
- Use Destroy(myObject) to destroy an Object and release its memory. Setting a reference to a Object to null does not destroy it.
- You should set persistent (long-term) objects as classes and ephemeral (short-term) objects as structs. Structs are not allocated on the heap and thus not garbage collected.
- Reuse temporary work buffers to keep temporary garbage low, instead of allocating frequently.
- An Enumerator does not clean up its memory until it exits.
- You should avoid never-ending Coroutines, especially when allocating large amounts of managed memory within on, as Coroutines hold onto stack allocations on the heap until the Coroutine ends.
Please read the understanding managed memory section of the Understanding Optimization in Unity guide to gain a deeper understanding of the managed heap.
3.IL2CPP & Mono
On iOS and Android, choose between the Mono or IL2CPP Scripting Backends in Player Settings. To change the Scripting Backend, go to the Player Settings window (menu: Edit > Project Settings > Player), scroll down to the Other Settings section, and select either Mono or IL2CPP from the Scripting Backend drop-down menu.Note: As of 2017.3, choose either the IL2CPP Scripting Backend or the Mono Scripting Backend. However, both WebGL and UWP only support IL2CPP. iOS still supports the Mono Scripting Backend for fast iteration, but you cannot submit Mono (32-bit) application to Apple anymore.
Benefits and drawbacks of different Scripting Backends
Each Scripting Backend has benefits and drawbacks that should influence your decision on which is the right choice for your situation:IL2CPP
- Code generation is heavily improved compared to Mono.
- Debugging Script code in C++ from top to bottom is possible.
- You can enable Engine code stripping to reduce code size.
- Build times are longer than with Mono.
- Only supports Ahead of Time (AOT) compilation.
Mono
- Faster build times than IL2CPP.
- Supports more managed libraries due to Just In Time compilation (JIT).
- Supports runtime code execution.
- Must ship managed assemblies (.dll files that mono- or .net– produces).
Tip: You should use IL2CPP to both develop and ship your Project. If iteration times end up being too slow using IL2CPP, switch temporarily to the Mono Scripting Backend during development to improve iteration speed.Note: The default target architectures in the Player Settings are optimized for release builds. Using this default during development increases your build time because Unity builds the binary for each target architecture selected:
- The default Target Architecture in the Android Player Settings are armv7 and x86 with the IL2CPP and Mono Scripting Backend.
- The default Architecture in the iOS Player Settings are armv7 and arm64 with the IL2CPP Scripting Backend.
Code stripping in Unity
Code size has a direct influence on disk space and runtime memory. It’s important that Unity removes any code paths you aren’t using from the code base. Unity strips code automatically during a build, working on two different levels:
- Managed code stripping
- Native code stripping
Managed code stripping
Unity strips managed code at the method level. To change the Stripping Level, go to the Player Settings window, scroll down to the Other Settings section, locate the Stripping Level drop-down menu and select Strip Assemblies .The UnityLinker removes unused types (classes, structs, etc.) from the Intermediate Language (IL). Even if you use a type, the UnityLinker removes the type’s unused methods.Note: Although this functionality is optional on builds using the Mono Scripting Backend, it is always enabled on builds using the IL2CPP Scripting Backend.
Native code stripping
Unity enables Strip Engine Code by default in the Player Settings and enables native code stripping. Enable Strip Engine Code to remove unused modules and classes in the native Unity engine code. Disable Strip Engine Code to preserve all of the modules and classes in the native Unity engine code.Note: For publically available platforms, native code stripping is only supported on iOS, WebGL, and Android.Unity 2017.3 onwards supports native code stripping on Android; in prior versions, the Unity Android runtime shipped as a pre-linked .so library, which Unity could not strip. The Android runtime shipped in 2017.3 is a static engine code library, allowing for native code stripping. The final link happens during the build, which is ultimately what accounts for the slightly longer build times.
Unity Module Stripping
Note: WebGL is currently the only platform which supports stripping unused Unity modules.Unity makes the best attempt to eliminate all unused Unity modules. This means if any Scene uses or any script references a component from a Unity module you include in the build, Unity doesn’t strip the module. Unity doesn’t strip core modules, such as Camera, AssetBundle, Halo, etc. but in future releases, Unity strips these too.
Stripping modules from an empty project on WebGL
Removing modules saves a substantial amount of memory. For example, one of the largest modules in Unity is the physics module, which accounts for about 5MB of gzipped ASM.js code. If you remove the physics module of an empty Project it reduces the build size from 17MB to 12MB.
C# Code Stripping
The UnityLinker works on a basic mark and sweep principle, similar to a garbage collector. The UnityLinker builds a map of each type and method included in each assembly from a build. The UnityLinker marks a number of types and methods as “roots” and the UnityLinker then walks the graph of dependencies between types and methods.If, for example, one type’s method calls a method on another type, then the Unity Linker marks the called type and methodas in-use. Once the UnityLinker marks all the roots’ dependencies, the system reweaves the assemblies, omitting methods or entire types that are not marked as used.
Roots from Scenes, Resources, Assemblies, and AssetBundles
The UnityLinker marks its internal classes as roots if they’ve been used in a Scene or from content in Resources. Similarly, the UnityLinker marks all types and methods in the user assemblies as roots.If you use types and methods from other assemblies directly in a Scene or in an Asset you include in resources, Unity marks these as roots.Use the link.xml file to mark additional types and methods as roots. If your Project uses AssetBundles, use the BuildPlayerOption.assetBundleManifestPath to mark additional types and methods as roots too.
User Assemblies
User Assemblies are the assemblies Unity generates from loose code within the Assets folder. Unity places most of the C# code in Assembly-CSharp.dll; whereas Unity places code in /Assets/Standard Assets/ or /Assets/Plugins/ in Assembly-CSharp-firstpass.dll, which is also considered a user assembly.If a significant proportion of a codebase’ types or methods are unused, you could save some binary-size and build time by migrating stable code into pre-built assemblies and allowing the UnityLinker to strip them. Use Assembly Definition Files to migrate stable code into pre-built assemblies.
Generic Sharing
For reference types, IL2CPP generates the implementation (C++ code) which can be shared between Generics using reference types. However, IL2CPP doesn’t share value types because IL2CPP needs to generate the code for each of the types separately. This results in your code size increasing.In general, there should not be any noticeable performance difference, but it depends on the specific use-case and what it should be optimized for. Classes are usually on the heap while structs are on the stack (with some exceptions, such as in the case of coroutines). For memory performance and usage this matters, and using non-reference types leads to other problems. You must copy function parameters using value types to influence performance. For additional information see this blog post for more information. Be warned though that Integer or Enum types are not shared at this moment.
Assembly Definition Files
Assembly Definition Files allow you to define custom managed assemblies and assign user Scripts to them on a per-folder basis.In turn, this results in faster iteration times, because Unity will only build those assemblies actually affected by script changes.Note: While multiple assemblies do grant modularity, they also increase the application’s binary size and runtime memory. Tests show that the executable can grow by up to 4kB per assembly.
Build Report
Build Report is an API which is included in Unity but has no UI yet. Building a Project generates a buildreport file which lets you discover what is stripped and why it was stripped from the final executable.To preview the stripping information:
- Build your Project.
- Leave the Editor open.
- Connect to http://files.unity3d.com/build-report/.
The Build Report tool connects to your running Unity Editor, downloads and presents the breakdown of the build report.It’s possible to use the binary2text tool on the generated file in Library/LatestBuild.buildreport to view data from the report. Binary2text is shipped with Unity under Unity.app/Contents/Tools/ on Mac or Unity/Editor/Data/Tools/ on Windows. The build report is available in Unity 5.5 and later.
4.Native Memory
Native memory is a key component when optimizing applications as most of the engine code is in resident memory. When you integrate code in Native Plugins you can control it directly, however it is not always possible to control and optimize the native memory consumption from Unity internal systems. Internal systems use different buffers and resources, and it may not always be apparent how that influences memory consumption. The following section details Unity internal systems and explains memory data you often see in a native profiler.
Native Buffer
Unity uses many different native allocators and buffers. Some are persistent, such as the constant buffer, while others are dynamic, such as the back buffer. The following subsections describe buffers and their behavior.
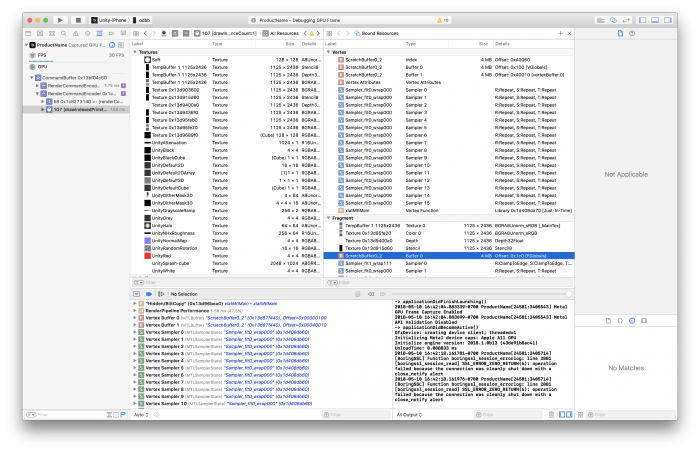
Scratchpad
Unity stores constants in a 4MB buffer pool and cycles through the pool between frames. The pool is bound to the GPU for the duration of its lifetime and shows up in frame capture tools such as XCode or Snapdragon.
Block allocator
Unity uses block allocators in some internal systems. There is memory and CPU overhead anytime Unity needs to allocate a new page block of memory. Usually, the block size of the page is large enough that the allocation only appears the first time Unity uses a system. After the first allocation, the page block is reused. There are small differences in how internal systems use the block allocator.
AssetBundles
The first time you load an AssetBundle, additional CPU and memory overhead is required as the block allocators spin up, allowing the Asset Bundle system to allocate the first page block of memory.Unity reuses the pages that the Asset Bundle system allocates, however, if you want to load many Asset Bundles at once you may have to allocate a second or third block. All of these stay allocated until the application terminates.
Resources
Resources use a block allocator shared with other systems, so there is no CPU or memory overhead when loading an Asset from Resources for the first time (as it already happened earlier during startup).
Ringbuffer
Unity uses a ring buffer to push textures to the GPU. You can adjust this async texture buffer via QualitySettings.asyncUploadBufferSize. Note: You cannot return Ring buffer memory to the system after Unity allocates it.
Assets
Assets cause native and managed memory implications during runtime. Beyond managed memory, Unity returns native memory to the operating system when no longer needed. Since every byte counts – especially on mobile devices – you can try the following to reduce native runtime memory:
- Remove unused channels from meshes
- Remove redundant keyframes from animations
- Use maxLOD in the Quality Settings to remove higher detail meshes in LODGroups from the build
- Check the Editor.log after a build to ensure that the size of each Asset on disk is proportional to its runtime memory use
- Reduce memory uploaded to GPU memory by using the Texture Quality setting in the Rendering section of the Quality Settings to force lower texture resolutions via mipmaps
- Normal maps need not be the same size as diffuse maps (1:1), so you can use a smaller resolution for normal maps while still achieving high visual fidelity and saving memory and disk space
Be aware that managed memory implications can often surpass native memory problems, due to heavy fragmentation of the managed heap.
Cloned Materials
Beware of cloned materials, as accessing the material property of any renderer causes the material to be cloned even if nothing is assigned. This cloned material will not be garbage collected and is only cleared up when you change Scenes or call Resources.UnloadUnusedAssets(). You can use customRenderer.sharedMaterial if you want to access a read-only material.
Unloading Scenes
Call UnloadScene() to destroy and unload the GameObjects associated with a Scene. Note: This does not unload the associated Assets. In order to unload the Assets and free both managed and native memory, you need to call Resources.UnloadUnusedAssets() after the Scene has been unloaded.
Audio
Virtual Voices
Unity dynamically sets voices as either virtual or real, depending on the real time audibility of the platform. For example, Unity sets sounds that are playing far off or with a low volume as virtual, but will change these sounds to a real voice if they come closer or become louder. The default values in the Audio Settings are great values for mobile devices.
| Max Virtual Voice Count | Max Real Voice Count | |
| Default | 512 | 32 |
| Maximum | 4095 | 255 |
DSP Buffer Size
Unity uses the DSP buffer sizes to control the mixer latency. The underlying Audio System FMOD defines the platform dependent DSP buffer sizes. The buffer size influences the latency and should be treated carefully. The number of buffersdefaults to 4. The audio system in Unity uses the following sample counts for the Audio Settings in Unity:
| Latency = Samples * Number of Buffers | Samples | Number of Buffers |
| Default | iOS & Desktop: 1024 Android: 512 | 4 |
| Best latency | 256 | 4 |
| Good latency | 512 | 4 |
| Best performance | 1024 | 4 |
Audio Import Settings
Using the correct settings can save runtime memory and CPU performance.
- Enable Force to mono option on audio files if they do not require stereo sound; doing so will reduce runtime memory and disk space. This is mostly used on mobile platforms with a mono speaker.
- Larger AudioClips should be set to Streaming. Streaming in Unity 5.0 and later has a 200KB overhead so you should set audio files smaller than 200KB to Compressed into Memory instead.
- For longer clips, import AudioClips as Compressed into Memory to save runtime memory (if the clips are not set to Streaming).
- Use Decompress On Load only if you have plenty of memory but are constrained by CPU performance, as this option requires a significant amount of memory.
Various platforms also have preferred Compression Format settings to save runtime memory and disk space:
- Set Compression Format to ADPCM for very short clips such as sound effects which are played often. ADPCM offers a fixed 3.5:1 compression ratio and is inexpensive to decompress.
- Use Vorbis on Android for longer clips. Unity does not use hardware accelerated decoding.
- Use MP3 or Vorbis on iOS for longer clips. Unity does not use hardware accelerated decoding.
- MP3 or Vorbis need more resources for decompression but offer significantly smaller file size. High-quality MP3s require fewer resources for decompression, while middle and low-quality files of either format require almost the same CPU time for decompression.
- Tip: Use Vorbis for longer looping sounds since it handles looping better. MP3 contains data blocks of predetermined sizes so if the loop is not an exact multiple of the block size then the MP3 encoding will add silence while Vorbis does not.
5.Android Memory Management
Memory on Android is shared across multiple processes. How much memory a process uses is not clear at first glance. Android memory management is complex but there is a great talk on Understanding Android memory usage from Google I/O 2018 which you should take a look at before reading on.
Paging on Android
Paging is a method of moving memory from main memory to secondary memory or vice versa.Android pages out to disk but does not use swap space for paging the memory. This makes it even more difficult to see the total memory, especially as every application in Android runs in a different process which runs its own instance of a Dalvik VM.
Paging vs swap space
Android uses paging but does not utilize swap space. Paging relies heavily on the ability to memory map (mmap()) files and store the kernel page in data as needed. Although this doesn’t happen often, paging needs to drop kernel pages when memory is low and the system drops cache page files. Android does not swap spaces for paging out dirty pages, as doing so on mobile devices both lowers battery life and causes excess wear-and-tear on memory.
Onboard flash
Android devices frequently come with very little onboard flash and limited space to store data. This is mainly used to store apps but could actually store a swap file. Onboard flash is slow and has generally worse access rates than those of hard disks or flash drives. Although onboard flash size has improved recently, it is still not enough to enable swapping spaces effectively. A basic rule of thumb for swap file size is about 512MB per 1-2GB RAM. You can always enable swap support by modifying the kernel .config file (CONFIG_SWAP) and compiling the kernel yourself, but doing so falls outside the scope of this guide.
Memory Consumption Limitations
Just how much memory can your app use before the Android system (aka memory killer) activates and starts shutting down processes? Unfortunately, there is no simple answer, and figuring it out involves a lot of profiling with the tools such as dumpsys, procrank, and Android Studio.Many different factors can influence your ability to measure memory consumption on Android such as the following:
- Different platform configuration for low, mid, and high-end devices
- Different OS versions on the test device(s)
- Different points in your application when you measure memory
- Overall device memory pressure
It is important to always measure your memory at the same location in your code with the same platform configuration, OS version, and device memory pressure.
Low and high memory pressure
A good way to profile memory is to ensure that the device has plenty of free memory available (low memory pressure) while you profile the memory consumption of your application. If the device has no free memory available (high memory pressure) it can be difficult to get stable results. It’s important to keep in mind that although you use profiling to try to find the source of high memory pressure, there are still hard physical limitations. If the system is already thrashing memory caches, it will produce unstable results during memory profiling your app.
Dumpsys
If you were to sum up all physical RAM mapped to each process, then add up all of the processes, the resulting figure would be greater than the actual total RAM. With dumpsys, you can get clearer information about each Java process. The stats dumpsys provides contain a variety of information related to the apps’ memory. dumpsys is an Android tool that runs on the device and dumps information about the status of system services and applications. dumpsys enables you to easily access system information.
- Get system information in a simple string representation.
- Use dumped CPU, RAM, battery, and storage to check how an application affects the overall device.
The following command lists all services offered by dumpsys:~$ adb shell dumpsys | grep “dumpsys services”You can use dumpsys meminfo to dump system memory on Android.
dumpsys meminfo
adb provides a host of tools to gain information about the memory of a running application on Android. The most common and quickest way to get an overview is the adb shell dumpsys meminfo command. It reports detailed information about the memory usage of each Java process, native heap, binary data as well as a variety of process and system information. The following command will provide a quick overview of system memory:~$ adb shell dumpsys meminfoIt’s possible to track a single process via name, bundle ID or pid to determine the details of the Unity androidtest app as the following command shows. The androidtest app is an empty Unity Project with only one main Scene, no Skybox, and no content, to get a baseline for memory measurements.~$ adb shell dumpsys meminfo com.unity.amemorytestThis prints the following information in the command line using a Nexus 6P (2560 by 1440 px – Android 8.1.0 and Unity 2018.1).
* Applications Memory Usage (in Kilobytes):
* Uptime: 6815563691 Realtime: 10882940478
*
* ** MEMINFO in pid 20676 [com.unity.androidtest] **
*                    Pss  Private  Private  SwapPss     Heap     Heap     Heap
*                  Total    Dirty    Clean    Dirty     Size    Alloc     Free
*                 ------   ------   ------   ------   ------   ------   ------
*   Native Heap    31467    31448        0        0    51072    47261     3810
*   Dalvik Heap     1872     1760        0        0    12168     7301     4867
*  Dalvik Other      470      460        0        0
*         Stack      492      492        0        2
*        Ashmem        8        0        0        0
*       Gfx dev     3846     2036        0        0
*     Other dev        4        0        4        0
*      .so mmap    17760      516    15908      161
*     .jar mmap        4        0        4        0
*     .apk mmap      243        0        0        0
*     .dex mmap      116        4      112        0
*     .oat mmap     6206        0     3244        0
*     .art mmap     2571      716      232       22
*    Other mmap       49        4        0        2
*    EGL mtrack    99840    99840        0        0
*     GL mtrack    64480    64480        0        0
*       Unknown     1270     1264        0       14
*         TOTAL   230899   203020    19504      201    63240    54562     8677
*
*  App Summary
*                        Pss(KB)
*                         ------
*            Java Heap:     2708
*          Native Heap:    31448
*                 Code:    19788
*                Stack:      492
*             Graphics:   166356
*        Private Other:     1732
*               System:     8375
*
*                TOTAL:   230899       TOTAL SWAP PSS:      201
*
*  Objects
*                Views:        7         ViewRootImpl:        1
*          AppContexts:        2           Activities:        1
*               Assets:        2        AssetManagers:        2
*        Local Binders:       16        Proxy Binders:       21
*        Parcel memory:        5         Parcel count:       23
*     Death Recipients:        1      OpenSSL Sockets:        2
*             WebViews:        0
*
*  SQL
*          MEMORY_USED:        0
*   PAGECACHE_OVERFLOW:        0          MALLOC_SIZE:        0
In contrast, executing the same command using an application featuring a full 3D Scene and a significantly higher amount of content prints the following information:
* Applications Memory Usage (in Kilobytes):
* Uptime: 6823482422 Realtime: 10890859209
*
* ** MEMINFO in pid 22903 [com.unity3d.androidtest] **
*                    Pss  Private  Private  SwapPss     Heap     Heap     Heap
*                  Total    Dirty    Clean    Dirty     Size    Alloc     Free
*                 ------   ------   ------   ------   ------   ------   ------
*   Native Heap   304918   304900        0        0   327552   315885    11666
*   Dalvik Heap     1240     1096        0        0    11858     7127     4731
*  Dalvik Other      424      412        0        0
*         Stack      528      528        0        1
*        Ashmem        6        0        0        0
*       Gfx dev   196934   132128        0        0
*     Other dev        4        0        4        0
*      .so mmap    23976      668    21920      199
*     .apk mmap      368        0        0        0
*     .dex mmap      116        4      112        0
*     .oat mmap     6060        0     3768        0
*     .art mmap     2774      604      332       25
*    Other mmap       44        4        0        2
*    EGL mtrack    21600    21600        0        0
*     GL mtrack   384184   384184        0        0
*       Unknown     6577     6568        0       17
*         TOTAL   949997   852696    26136      244   339410   323012    16397
*
*  App Summary
*                        Pss(KB)
*                         ------
*            Java Heap:     2032
*          Native Heap:   304900
*                 Code:    26472
*                Stack:      528
*             Graphics:   537912
*        Private Other:     6988
*               System:    71165
*
*                TOTAL:   949997       TOTAL SWAP PSS:      244
*
*  Objects
*                Views:        7         ViewRootImpl:        1
*          AppContexts:        3           Activities:        1
*               Assets:        2        AssetManagers:        2
*        Local Binders:       15        Proxy Binders:       20
*        Parcel memory:        3         Parcel count:       14
*     Death Recipients:        0      OpenSSL Sockets:        0
*             WebViews:        0
*
*  SQL
*          MEMORY_USED:        0
*   PAGECACHE_OVERFLOW:        0          MALLOC_SIZE:        0
*
The following table compares the results and describes the detailed stats:
| Area | Empty Scene [MB] | Full Scene [MB] | Description |
| Pss | 230 | 949 | Proportional set size (Pss) is a metric the kernel computes that takes memory sharing into account. The system scales each page of RAM in a processby the ratio of the count of other processes using the same page. All private pages contribute 100% of their size, and shared memory contributes size/(num of processes shared). For example, a page that is shared between two processes will contribute half of its size to the Pss of each process. This way you can calculate the total RAM used by summing up the Pss across all processes. Comparing Pss between processes provides a rough idea of their relative weight. |
| Private Dirty | 203 | 825 | The most interesting and expensive metric is Private Dirty, which is the amount of RAM inside the process that cannot be paged to disk as it is not backed by the same data on disk, and the system cannot share with any other process. Another way to look at this is that this is the RAM that the system will reclaim when the application is destroyed. After reclaiming, it is quickly subsumed into caches and other uses because the system must fully utilize the limited memory available. |
| Native Heap | 51 | 328 | The Native Heap represents memory used by the process itself such as Unity Engine Code, Native C mallocs, and Mono VM. |
| Dalvik Heap | 12 | 12 | Dalvik Heap is memory the Dalvik VM allocates, for example; Variables in the Unity Java Android code. |
| Dalvik Other | 0.4 | 0.4 | Dalvik Other is memory used for JIT and Android GC. |
| Clean Memory | 19 | 26 | Android shares pages of memory among several processes such as code of common frameworks. As soon as memory in a page changes, the system must write to and modify the memory and flags the memory as dirty. However, clean memory is memory that hasn’t changed from when it was loaded from disk. If a change occurs, the memory becomes dirty. |
| Swapped Dirty | 0.2 | 0.2 | The application uses Dirty memory as space for computations. Android does not have a swap mechanism so dirty memory is also RAM that will be freed when the app exits. However, Swapped Dirty is used on some Android devices with the ability to remap, but they swap to RAM rather than flash. On Android, this is similar to Linux. ZRAM can compress pages and the Linux kernel swaps them to a special RAM area and decompresses them again when needed. |
| EGL mtrack | 99 | 22 | This is gralloc memory usage. It’s primarily the sum of the SurfaceView and TextureView. It includes the frame buffer as well and therefore the size depends on the dimension of the framebuffers. The bigger the supported screen resolution, the higher the EGL mtrack number. In this test, the resolution of frame buffer for the full Scene was reduced to ensure good performance. Reducing the frame buffer size also reduces the amount of memory needed by these buffers. |
| GL mtrack & Gfx dev | 69 | 581 | GL and Gfx are driver-reported GPU memory, and are primarily the sum of GL texture sizes, GL command buffers, fixed global driver RAM overheads, and Shaders. Note that this number does not appear on older Android versions. Note: The client space driver and kernel space driver share a memory space. In some Android versions this sometimes gets counted twice and therefore the Gfx dev is bigger than it is in reality. |
| Unknown | 1.3 | 6.5 | Unknown is any RAM page that the system could not classify into one of the other more specific items. This includes native allocations or runtime metadata, which the tool cannot identify when collecting this data due to Address Space Layout Randomization. Private Dirty is unknown RAM dedicated to only your application. |
###<a name=”procrank”></a> procrankOne alternative to dumpsys is procrank, another useful tool that you can use to view memory usage across all processes. It lists the memory usage of processes in order from highest to lowest usage. The sizes reported per process are Vss, Rss, Pss, and Uss.~$ adb shell procrank
* PID      Vss      Rss      Pss      Uss  cmdline
*  890   84456K   48668K   25850K   21284K  system_server
* 1231   50748K   39088K   17587K   13792K  com.android.launcher2
*  947   34488K   28528K   10834K    9308K  com.android.wallpaper
*  987   26964K   26956K    8751K    7308K  com.google.process.gapps
*  954   24300K   24296K    6249K    4824K  com.unity.androidmemory
*  888   25728K   25724K    5774K    3668K  zygote
* 977 24100K 24096K 5667K 4340K android.process.acore- Vss – Virtual set size is the total accessible address space of a process. It shows how much virtual memory is associated with a process.
- Rss – Resident Set Size is how many physical pages are allocated to the process. Pages shared between processes are counted multiple times.
- Pss – Proportional Set Size takes the Rss number but evenly distributes shared pages among the sharing processes. For example, if three processes are sharing 9MB, each process gets 3MB in Pss.
- Uss – Unique Set Size is also known as Private Dirty, which is basically the amount of RAM inside the process that cannot be paged to disk as it is not backed by the same data on disk, and is not shared with any other processes.
Note: Pss and Uss are different than reports of meminfo. Procrank uses a different kernel mechanism to collect its data than meminfo which can give different results.
meminfo
The meminfo command gives a summary of the overall memory usage of the system:~$ adb shell cat /proc/meminfoThe first couple of numbers are worth discussing.
* MemTotal:        2866492 kB
* MemFree:          244944 kB
* Buffers:           36616 kB
* Cached:           937700 kB
* SwapCached: 13744 kB- MemTotal is the total amount of memory available to the kernel and userspace which is usually less than actual physical RAM as the handset requires memory for GSM, buffers, etc. as well.
- MemFree is the amount of RAM that is not being used at all. On Android the number would typically be very small as the system tries to always use all available memory to keep processes running.
- Cached is the RAM being used for filesystem caches etc.
For additional information please also read the RAM investigation page and Android performance guides.
Android Studio
Android Studio offers a memory profiler in addition to the command line tools available in the Android SDK. Similar to the command line tools reporting there is a split between managed and native memory.
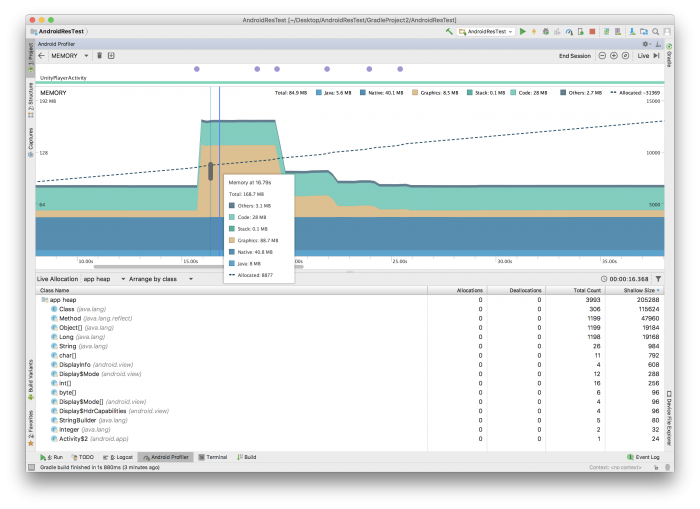
In this case, the table compares the empty Project from the dumpsys meminfo section with the data from Android Studio. It basically covers the App Summary displayed from dumpsys meminfo with some additions.
| Section | Size [MB] | Area |
| Total [mb] | 168.7 | All |
| Others [mb] | 3.1 | Other dev + Unknown |
| Code [mb] | 28 | mmaps |
| Stack [mb] | 0.1 | Stack |
| Graphics [mb] | 88.7 | Gfxdev + EGL mtrack + GL mtrack |
| Native [mb] | 40.8 | Native Heap |
| Java [mb] | 8 | Dalvik Heap |
Plugins
Usually, most of the memory goes into the Native Heap section. The Dalvik Heap is small compared to the Native Heap section. In case it grows, you should investigate the Android plugins you use in your application. The Native Heap makes it difficult to know where memory comes from and there is no great way to see Native Plugin allocations in the profiler. A possible solution to gain a greater insight is to isolate and measure the plugins used for 3rd party integrations and compare them with the memory baseline of an empty Project.
6.Application Size
One way you can save disk space and runtime memory is to reduce the size of your .apk on Android or .ipa on iOS. Resources and code are directly proportional to runtime memory and if you can reduce them, you can save runtime memory. Please read Code stripping in Unity to learn more about reducing code size and read this knowledge base article if you want to understand the details of IL2CPP optimization on iOS.
Post Link: [Unity][教程]Memory Management in Unity